About CSynth
Academic Leads
Frederic Fol Leymarie, William Latham, Stephen Todd, Peter Todd Goldsmiths, University of London.
Stephen Taylor, Jim Hughes, Veronica Buckle Weatherall Institute, University of Oxford
Part of chr16 from white and red blood cells, modelled using CSynth:
What is CSynth?
CSynth is a physics based interactive visualisation platform for visualizing the 3D structure of the biological molecules.
It is primarily designed to provide an engaging way to explore and understand the complex structure of the genome in 3D by
integrating data from next generation sequencing (Hi-C) and modelling. For example, it allows the user to see a traditional
Hi-C heat map overlaid with dynamically generated or precomputed 3D structures.
CSynth has now been published: Bioinformatics. 2020 Aug 31;btaa75
What is CSynth used for?
Recently scientists have begun to look at different groups of cells using so called ‘capture’ or ‘C’ techniques to look at where regions of the genome interact with each other. After some processing this produces a 2D interaction map which infers which part of the genome interacts with another part of the genome forming Topologically Active Domains or TADs.
However, these maps are not very intuitive to understand because we know the structure is in 3D. Steve Taylor (Computational Biology Research Group, MRC WIMM) and Frederic Fol Leymarie (Department of Computing, Goldsmiths University) began discussions after Steve saw Frederic presenting FoldSynth at BioVis and with Jim Hughes (Genome Biology, MRC WIMM), Stephen Todd (London Geometry) and Peter Todd (London Geometry) and William Latham (Department of Computing, Goldsmiths University) developed a prototype viewer called CSynth based on the 3D molecule viewer FoldSynth. They are seeking funding from various sources to continue develop this into a complete software package that also will allow import of public data, cutting edge 3D super resolution microscopy and detailed polymer models of the genome to get a much better understanding of how the genome is folded in cell and understand the complex mechanisms involved.
Even though the current prototype model of CSynth at this stage is not a ‘full’ modelling package (it uses simplified rules to model the DNA and currently does include any of the scaffolding proteins) it is allowing scientists to think about and pose questions more intuitively how and why genes, promoters and enhancers in different regions of the genome interact.
Try CSynth
CSynth is now available to try out yourself at CSynth.org. Video walk-throughs are available in the Help section. Your own data may be uploaded to CSynth, but be sure to try out the examples first. If you have a connected HTC Vive headset, Virtual Reality allows a completely new way to look at the data in 3D!
Gallery
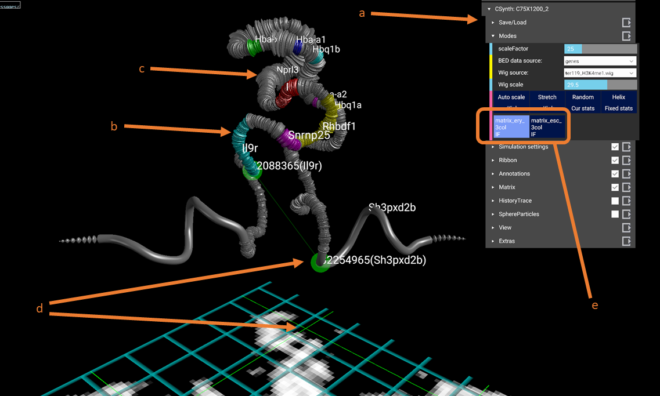
The figure above is a screenshot of CSynth with the two models loaded. (a) shows the menus that can be used to interact with the visualisation. (b) shows genes uploaded as BED format file for the region. Multiple BED files may be uploaded and switched between using the menu under the Modes or Annotations sections. (c) Visualisation of H3k4me1 data that has been uploaded in WIG format, is show as a widening of the diameter of the ribbon or chromatin backbone. The diameter of the ribbon may be adjusted interactively using the wigmult parameter in the Ribbon section of the menus. Similar to BED files multiple WIG format files may be uploaded and selected to view. (d) Using the mouse or VR pointer clicking any part of the heatmap shows a green intersecting line that represents the point selected and the position is also shown as a corresponding point on the 3D model. This is useful when investigating patterns seen in the heatmap and their corresponding structures. (e) Shows the buttons that are generated when you upload more than one model.
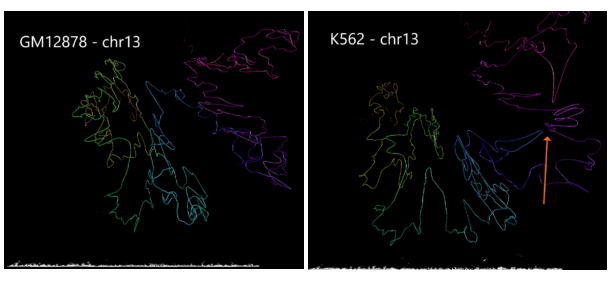
Using data from the Cell Paper (Rao et al. 2014) “A 3D Map of the Human Genome at Kilobase Resolution Reveals Principles of Chromatin Looping” a structural variant is clearly visible when comparing between the two cell types on chromosome 13. CSynth gives some insight in how such structural variants physically would change the structure of chromatin.